Card Data
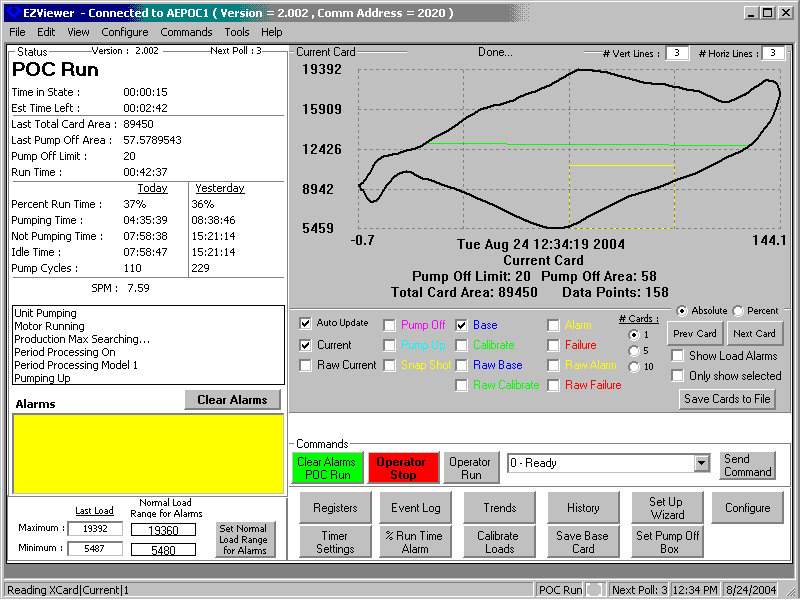
This is the main operating screen the operators will use. It provides card information, time in state information, and push buttons for most commonly used functions.
Event Log Data
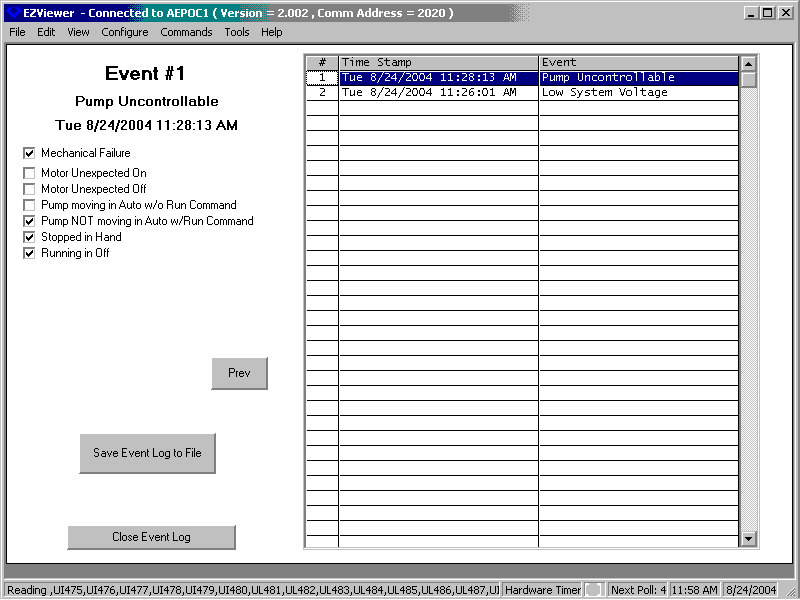
When an unusual monitored event occurs, an event log entry can be generated. This allows you to go back in time to see what led up to a well alarm. In addition to the time and specific event that was seen, some information is provided by most events to show what the triggering condition for the event was.
Historical Data
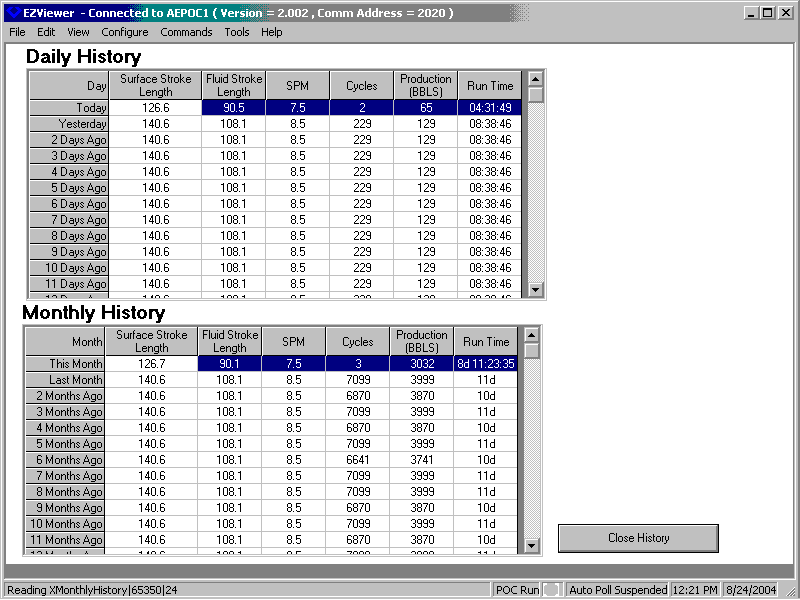
Some basic information is collected each pumping stroke. This is recorded in the historical data. Daily data is retained for a period of 36 days. Monthly data is retained for a period of 24 months.
Trend Data
General Trends
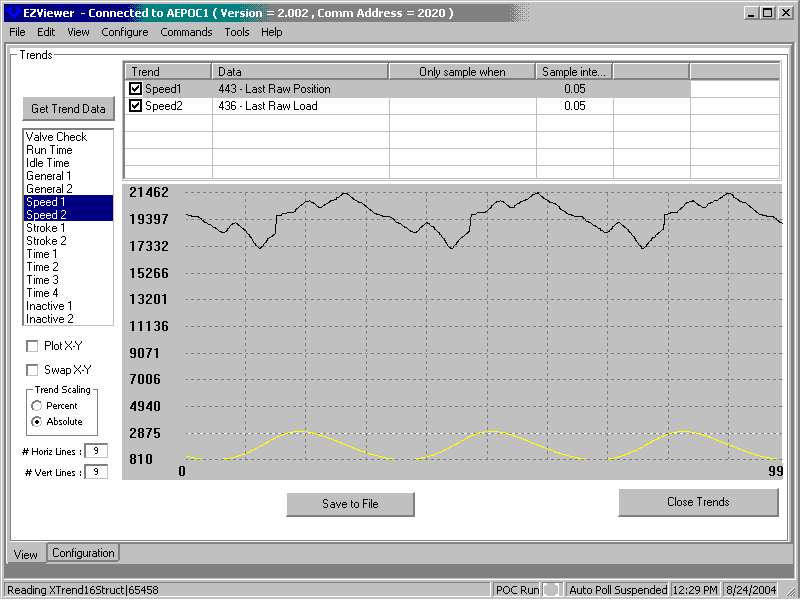
Numeric registers may be selected for trending. This can be graphed to show pressure over time and the like. Multiple data points may be overlaid on the graph for comparison purposes.
X-Y Trends
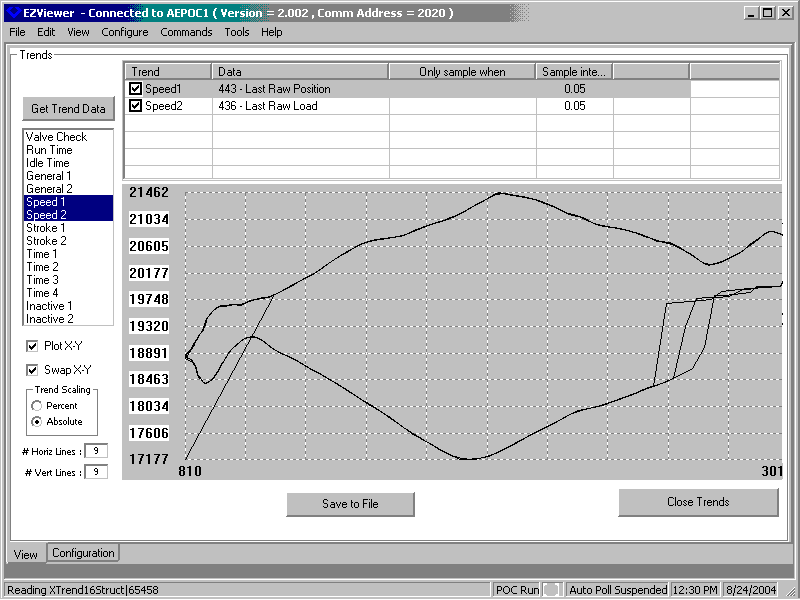
Two data points may be selected for trending. Typically this will be a miscellaneous A/D vs. position or a load versus position. It is trended at high speed synchronized to load and position.
Register Data
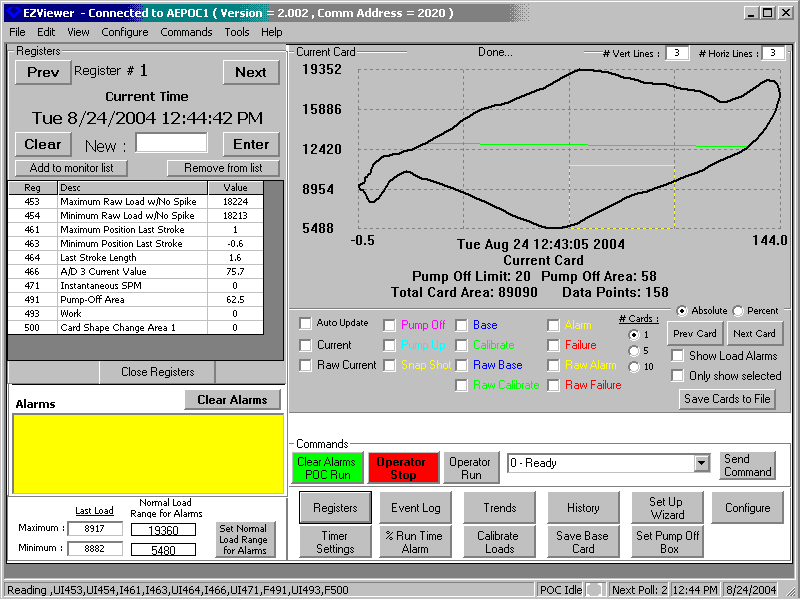
Although most information an operator would want to see is already available on the card display, there are times when a particular register is of interest. This is particularly true when doing user programming. The user selected registers allow a group of registers to be polled with cards and displayed.