The AEPOC EZ-Viewer software interface provides a convenient and intuitive means of interacting with the rod pump controller. It provides four types of information:
- a control panel display, providing all important well status at a glance, along with the most often used controls in easy push button format.
- configuration displays, providing graphical configuration for most AEPOC functions,
- specialized data displays, providing detailed views of trend and historical data,
- basic hand held data terminal replacement, compatible with all versions of the AEPOC software.
Overview
The AEPOC EZ-Viewer software interface provides a convenient and intuitive means of interacting with the rod pump controller. It provides four types of information:
- a control panel display, providing all important well status at a glance, along with the most often used controls in easy push button format.
- configuration displays, providing graphical configuration for most AEPOC functions,
- specialized data displays, providing detailed views of trend and historical data,
- basic hand held data terminal replacement, compatible with all versions of the AEPOC software.
Specifications
Control Panel
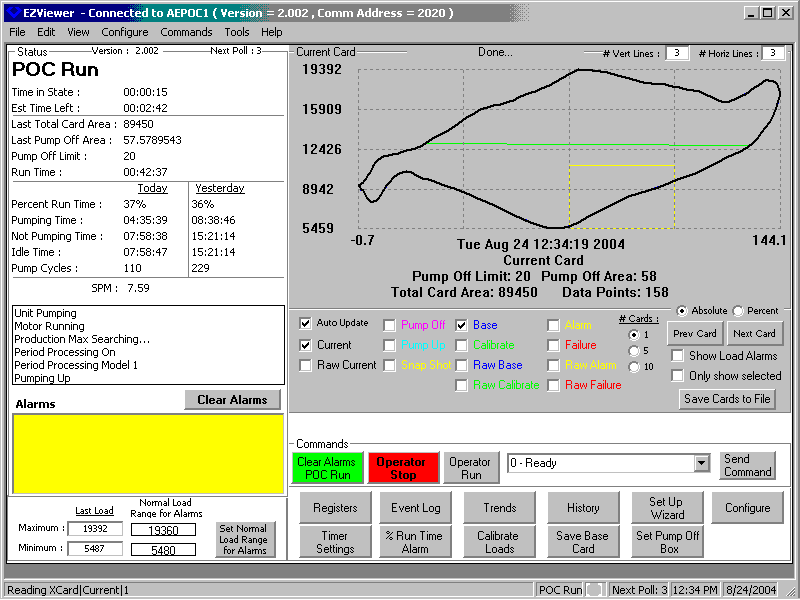
This display shows the current operating mode, card information, current and recent run time, and scrolling information in the upper left quadrant of the window. The upper right quadrant shows user selectible cards. The lower left quadrant displays alarm information and load ranges for the displayed cards. The lower right quadrant provides buttons to access frequently used EZ-Viewer features and issue common commands to the controller.
- Current Status Viewing Area: The information in the current status area includes the current mode of the controller, today's and yesterday's run time, idle time, and cycle information, and any current alarms. It also includes estimated time left in the state if possible, and information about the current card from the controller. This information is updated once per stroke.
- Card Viewing Area: This area allows the user to view the cards currently saved in the controller in any combination or available quantity. All selected cards are retrieved and may be overlaid or displayed sequentially. Descriptive information about each card is included. An auto update feature can be used with current or raw current cards to update the display when new cards are available.
Engineering unit cards show the final card after all input device conditioning has been applied. Raw cards show the card data as read from the end devices. Cards may be automatically scaled to 0 to 100% engineering unit cards and raw cards.
The cards can be saved to disk if desired. Colors for card information can be changed for various lighting conditions. - Alarm and Load Viewing Area: This area has the current alarms in the controller. A clear alarms button will clear the alarms in the controller. The load range on the currently selected card is also displayed. There is a button to download the range to the normal load range registers in the controller when using polished rod load cells.
- Command Area: The commands area provides buttons to start and stop the pumping unit as well as change operating modes of the controller. For less frequently used commands, a pull down lists is available. Each of the other major functions in the EZ-Viewer has an associated button for access. They are also available from the toolbar for users that prefer that interface.
Configuration
- A setup wizard guides a user through the setup of a new well configuring the end devices, starting the well, calibrating strain gauge load cells if needed, saving a base stroke, synchronizing position switch inputs to true top of stroke, and setting up the basic operating characteristics of the unit.
- Special buttons on configuration screens perform related commands without leaving the screen.
- The EZ-Viewer supports the creation of user defined templates allowing you to set up field or well type specific initialization data that can be easily downloaded when setting up a new well that will set most customer specific parameters for you, leaving just a few well specific parameters to change.
- General configuration screens allow users to configure basic features.
- I/O configuration screens provide basic position and load input configuration for various types of devices along with generic configuration of discrete inputs, outputs, and miscellaneous A/D inputs.
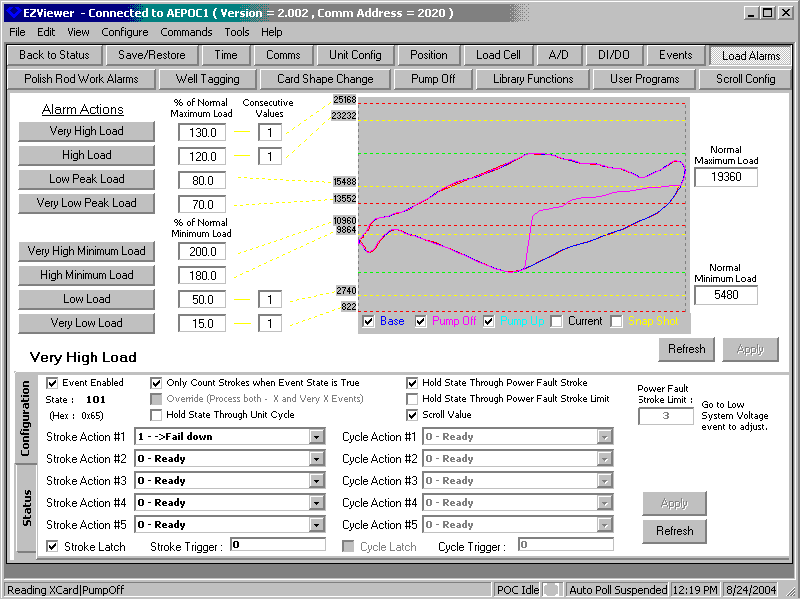
- Alarm and operational state configuration screens give the user complete control over triggering thresholds for the common alarms pumping units can encounter. Reference values are provided to aid in setting alarm limits. By default, percentages of normal expected values are used for automatic configuration once a normal value is set. Absolute values may be substituted to handle unusual configurations. Alarm limits are shown textually and graphically where possible. The configuration screens also allow the operator to alter the default alarm responses and sensitivity if these need adjusted for their installation. These can be adjusted from the same screen.
- Any numeric register can be trended by the AEPOC. Some trends are high speed, matching the data sampling of the card. Others are based on stroke, time intervals, or averaged for a pumping cycle. The trend configuration screens allow the points and time base or other sampling constraints to be specified as needed for a particular trend.
- Well analysts or Automation Electronics personnel can write custom programs that execute on a timed basis, a cycle basis, a stroke basis, or that control dynamically generated alarms. The user programming configuration screens allow the programs to be entered and edited as needed. They can be saved locally and then downloaded to the unit for execution. These can expand the functionality of the AEPOC beyond its initial configuration and allow testing new processes and devices. Eventually, useful programs that have been thoroughly debugged can be added to the core software in the unit as a library routine.
- Information provided to HHDT users can be configured via scrolling and message screens.
- Configuration of alarm, status, and control mode actions are also provided.
Data
The AEPOC can be configured to collect tens of thousands of registers worth of information in trends and historical summaries. Much of this is card data which is mapped into accessible registers on command of the host or operator. Other data is permanently available. The data displays present these collected data points to the user in easy to follow tabular or graphical form.
- The Card displays provide the usual position and load information along with alarm or warning information generated by the card and basic range information about loads and positions, along with work for the card.
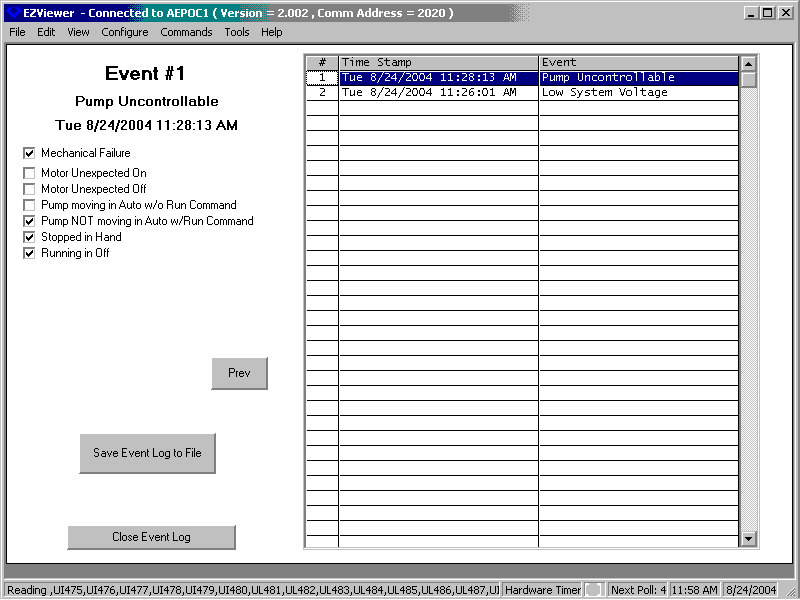
- The Event Log displays the controller's event log one event at a time with Previous and Next buttons to allow the user to navigate forward and backward through the time stamped event history of recent alarm and status changes at the unit to diagnose the cause of problems.
- Historical daily and monthly gauge off summaries show average fluid stroke length, surface stroke length, SPM, total cycles, fluid produced, and pumping unit time summaries.
- Trend Displays show collected stroke, cycle, time, and high speed trend data in overlaid or x-y format.
- Register Displays allow you to configure your own pick list of data you want to look up that is scanned on a stroke basis from the controller.
HHDT
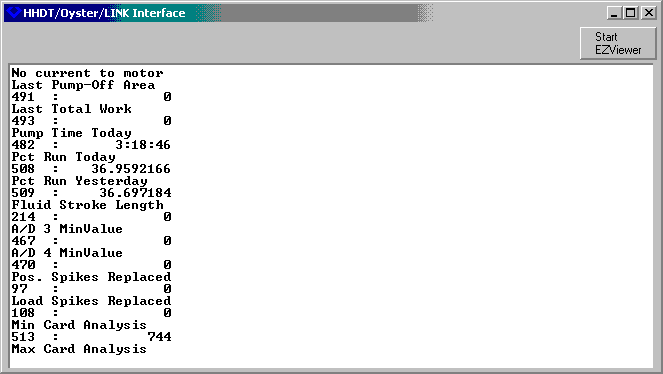
Finally, the EZ-Viewer also provides an emulation mode that simulates the Oyster Hand Held Data Terminals. This permits an operator to use the EZ-Viewer for wells with newer software in the full graphical mode of operation and still maintain compatibility with units that have not yet been upgraded.
Import/Export
RTU configuration data including base or reference cards can be saved to or downloaded from the PC to speed up the configuration process. EZ-Viewer also provides a means of saving card and trend data to disk for future reference or analysis in the office. This data can be saved in Comma Separated Variable (CSV) format so the data can be imported into various popular spreadsheets.
Requirements
The EZ-Viewer officially supports released versions 1.29 and later of the AEPOC core software, although various customers have had some luck using portions of it with releases as far back as 1.23. When used on unsupported versions, become familiar with features that have appeared in more recent releases and clearly understand that even though they may appear on the interface, they are not in the controller, and that attempting to select such features may cause problems in the operation of your AEPOC. Where register usage has changed or in rare cases moved, using the interface to change those registers may also cause faulty operation of the controller.
The EZ-Viewer program can be run on recent Microsoft® operating systems such as Windows® 98, Windows® 2000, and Windows® XP.
The video resolution should be at least 800x600 with 256 colors. A serial port is required for communication to the AEPOC. The software is distributed on CD-ROM.