To obtain meaningful results from Wave Equation analysis of surface dynamometer data, the acquired field data should meet certain minimum requirements. This paper will show the effects of the various parameters on the down hole cards. Various parameters will be examined and their effects shown. Some of the topics covered will be the effects of sampling frequency, aliasing, low-pass filtering data slew rate, and skew between load and position on the sampled data. A technique, improving signal to noise ratio and performance by over sampling and decimation will also be covered. It is hoped that this information will be useful in making informed decisions about system data gathering requirements.Chuck Wilson
Abstract
To obtain meaningful results from Wave Equation analysis of surface dynamometer data, the acquired field data should meet certain minimum requirements. This paper will show the effects of the various parameters on the down hole cards. Various parameters will be examined and their effects shown. Some of the topics covered will be the effects of sampling frequency, aliasing, low-pass filtering data slew rate, and skew between load and position on the sampled data. A technique, improving signal to noise ratio and performance by over sampling and decimation will also be covered. It is hoped that this information will be useful in making informed decisions about system data gathering requirements.
Introduction
Many older models of Pump-Off Controllers have been installed in the oil field, which cannot provide adequate information for modern host analysis programs. With the down sizing of field personal, and fluctuating oil prices, many operators are looking for ways to improve their monitoring systems. New applications which correct data by using the beam pump system kinematics, are good for design and analysis when the equipment is operating under nominal conditions, but this can mask equipment wear, anchor slippage, and small friction changes when conditions are less than ideal. Decisions made are only as good as information used to make them, which brings up the old saying, "Garbage In Garbage Out".
Several factors have been identified which affect the data integrity gathered at the Rod Pump Controller. It is the purpose of this paper to present information on each of these factors, specifically as they pertain to the acquisition of surface dynamometer data.
Data Resolution
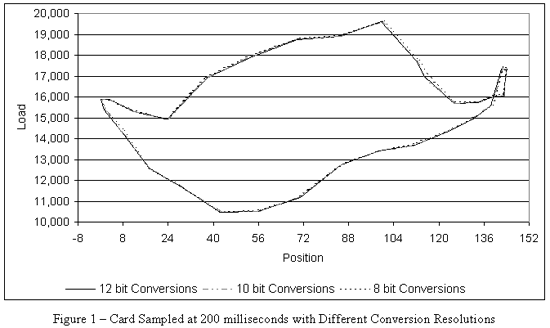
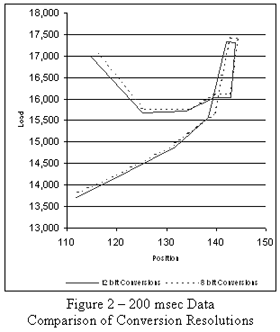
Polish Rod Cells produce a very minute voltage change for large variations of measured strain. For a typical thirty thousand pound load cell connected to a twelve bit A/D converter the smallest measurable voltage change would be about five micro volts, which is equivalent to 7.5 pounds resolution per one count. An eight bit converter is closer to 120 pounds per count.
The effects of different sampling resolutions for both load and position are shown in Figure 1 with a constant sampling frequency. This effect is difficult to represent due to the scale required, so a portion of the data is expanded in Figure 2. Notice an approximate 100-pound difference between the 8 bit and 12 bit results on the top portion of this card.
Sampling Frequency
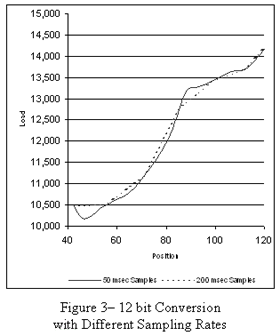
To accurately replicate an analog signal, as demonstrated in Figure 3, many data points must be gathered to approximate the real world. By sampling the data at four times the rate, every 50 milliseconds instead of 200, a much smoother waveform is produced. Notice also a large increase in detail produced at the higher sampling rate. Everything comes at a price; sampling at high speeds requires more data storage, faster processing efficiency, and longer data transmissions. If the sampling interval is slower than the bandwidth of the data, the collected samples are not a true representation of the waveform. This phenomenon is common to all digital sampling systems, and is called Aliasing.
Skew between Load and Position Data
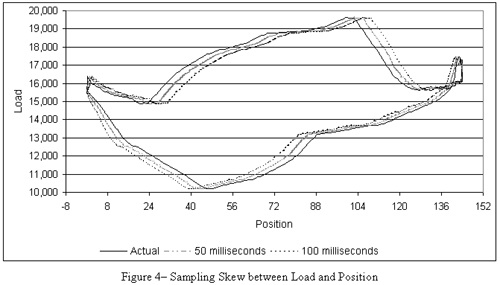
As shown in Figure 4 a small amount of skew between the load and position data, has a significant effect on the shape of a surface dynamometer card. This will usually cause the down hole cards to be distorted, sometimes resembling the shape typical of a slipping tubing anchor, or applying a slight rotation to the card.
Several instrumentation issues can aggravate this situation. The first is when the load and position data are converted by one A/D converter successively sampling one input then the other at a rate close to the sample interval. The second most influential contributor is the anti-aliasing low-pass filter, required for signal integrity. The third component is the transient protection devices leakage capacitance. And the fourth contributor is the combination of the instrument amplifiers input impedance and the cable capacitance.
Anti-aliasing
All data acquisition systems must sample real world data at some interval; the frequency of this interval is called the sampling frequency. Sampling Theory states that if the input spectrum of a signal vanishes beyond an upper frequency, then ideally the information can be uniquely determined from knowledge of its sampled values. If the sampling frequency is twice the upper frequency then the data is alias free and critically sampled at the Nyquist rate. If this condition is not met high frequency noise will be reflected and overlap the true signal causing data acquisition errors.
Noisy real world signals require band limiting to ensure the upper frequency has a maximum limit. Low-pass filters that provide this function are called anti-aliasing filters. Since practical real-world signals cannot be strictly band limited, sampling must be performed at greater than twice the Nyquist rate.
The sample frequency and guard band anti-aliasing filters must be coordinated so that there is at least 40 dB of suppression below the desired components. This anti-aliasing filtering must be performed prior to sampling. In general, there is no way to eliminate aliasing components reflected in the data once the signal has been improperly sampled.
Filter Techniques
Ideal filters would have rectangular magnitude responses and no group delay. When this is not the case the magnitude response of a practical low-pass filter will usually have one of four common shapes. In each of these cases the filter characteristics can be divided into three general regions. The pass band, which extends from direct current up to the filter cutoff frequency, the transition band, which slopes down from the pass band to the stop band, and the stop band, which extends up to higher frequencies and infinity.
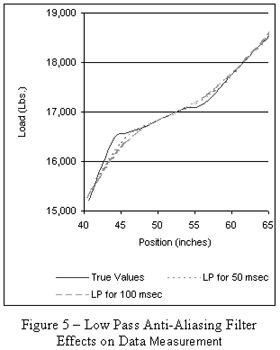
Because the cutoff response is not square and the transition region has some slope a real world low-pass filter will reduce the higher frequency components of the signal in magnitude. The effects of two anti-aliasing low-pass filters designed for sampling rates of 50 and 100 milliseconds are shown in Figure 5. Notice the sharper turns in the true data is lost due to these filter effects.
Another characteristic of real low-pass filters, is they introduce some group delay, which if not handled properly will cause skewing between load and position data.
A linear phase filter or an elliptical filter are the best choices for anti-aliasing, provided the signal does not have many high frequency components above the corner frequency.
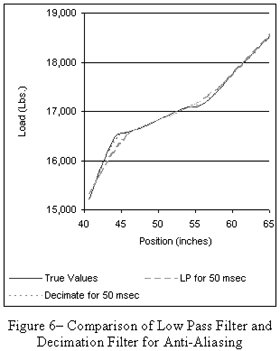
To overcome the limitations of the fixed analog filter a combination of over sampling and decimation, mixed with a first stage anti-aliasing filter, will improve the signal to noise ratio and increase the accuracy. This type of decimation is a digital filter technique, which is useful in preserving the high frequency components of the dynamometer data. This works by pushing the corner frequency of the anti-aliasing filter out to a much higher frequency, where the roll off and group delay do not affect the data. A comparison of a low-pass filter and decimation filter as required for a fifty-millisecond sample interval is shown in Figure 6.
Conclusion
To ensure accurate data capture, in a Rod Pump Controller it is necessary to provide a complete data acquisition system. This should include provisions for adequate conversion resolution, a sufficient quantity of readings to ensure quality analysis, simultaneous measurement of data pairs, protection against anti-aliasing, and sharp roll-off filters with a minimum group delay. If all of these requirements are met then useful decisions can be made, with a high probability of correctness.
References
- Brigham, E. Oran, The Fast Fourier Transform, Prentice-Hall, Inc., Englewood Cliffs, NJ, 1974
- Rorabaugh, Britt, Digital Filter Designer's Handbook, McGraw-Hill, Inc., 1993.
- Kaufman, Milton., Seidman, Arthur H., Handbook of Electronics Calculations for Engineers, McGraw-Hill, Inc., 1979.
- Christiansen, Donald, editor. - 4th, Electronics Engineers' Handbook, Fourth Edition, McGraw-Hill, Inc., 1996.
- Chao-Sun Pang, "Get the Most out of Your Data Recorder with the Right Anti-Aliasing Filter", Sensors Magazine, February 2000.