This paper shows some of the thought process that went into high polish rod work alarms on the AEPOC-2100 and the savings that this alarm feature provided the customers.
Mike Obrigewitsch - Shell Exploration and Production Company, Kalkaska, MI
Ted Lapis, Automation Electronics, Casper, WY
Introduction
During 1997 a customer in Montana called to say that the dynamometer cards produced by the Rod Pump Controller (RPC) were swelling slightly. A swelling or distortion along the vertical axis (load) was noticed compared to the reference card. The horizontal component of the card showing position was changed very little (slight rotation). Was the apparent change in load real, or was the equipment faulty?
During each stroke the RPC collects samples from load and position inputs. Pairs of load and position values are sampled every 5 milliseconds. Every 50 milliseconds ten load and position pairs are digitally filtered and plotted to form a surface dynamometer card. For example, at 6 Strokes Per Minute (SPM) 200 points are collected to produce the surface dynamometer card plot. Load is plotted along the vertical axis, position along the horizontal axis to form a surface dynamometer card for each stroke.
During RPC setup, a Base Card is collected for reference. A Current Card is drawn every stroke. Current Card load and position values are checked for both absolute value limits and rate of change violations. On-the-fly processing checks for conditions needing immediate response. End of stroke processing compares Current Card area to Base Card area, among other checks. The area enclosed by the surface dynamometer card is a measure of the polished rod workload for a complete stroke.
Load measurements from beam mounted transducers, and position inputs from proximity switches supplied data pairs. The Base Card or reference card position input plot had been recorded during RPC setup using a continuous potentiometer. Proximity switch position is fitted during RPC setup to permit comparing load and position values on Current Card with Base Card. Position data for Current Card is supplemented by SPM timing data to detect significant changes in stroke length.
Beam mounted transducers do not directly measure rod string loads, but give a relative measure of beam deflection. The resulting measurements must be calibrated to provide useful data about rod string loads. Polished rod load cells can directly measure loads, but they are mounted in an area that is subject to damage (especially during work over). Polished rod load cells are also generally more expensive than beam mounted transducers.
The acceleration and deceleration of long rod strings during a typical pumping unit stroke introduces more factors. Rod string dynamics introduce variables such as: momentum, vibration, rod stretch, buoyancy, valve pulsations, and noises both electrical and mechanical in nature. Load cells and beam mounted transducers challenge designers to produce consistent results needed for production analysis. Load spikes and other challenges need to be dealt with. Obtaining a reliable indication of rod loads during fluid production involves trade-offs.
Beam-mounted transducers are mounted away from work over action. Welding or clamping is used to mount transducer on beam. Improper mounting can lead to inconsistent results. They are not as likely to be damaged as polished rod load cells.
The joint investigation of customer concerns started by closely looking at the results to determine what was happening. The operation of the rod pump controller seemed to checkout OK. The card swelling seemed to correlate with a real dynamic load increase. Further investigation by the customer showed that the well would need an emulsification treatment soon after the dynamometer cards expanded. The field results showed that results were somewhat consistent, and might be useful for scheduling emulsion treatments.
Armed with this new information, the conditions were investigated to see what could be done to harness the observed changes and make a useful tool.
Defining a solution
The history of pump-off control shows that it is easier to protect equipment than production. Shutting down equipment may prolong equipment life at the expense of production. Unnecessarily shutting in production costs money. Fluids produced by a competitor are lost forever. Secondary and tertiary reservoir dynamics and operation expenses raise the ante even more.
Field trials were necessary for understanding the whole situation enough to develop a useful tool. A useful tool may be defined as one that is easy to use and produces good results. Training costs for new functions can make small gains uneconomic. A function that could be turned on with one command, yet allow enough flexibility so exceptional wells could benefit from the technique was needed.
Working with the customer to provide a useful tool was less of a trial and error process because a deep rod part event was already defined. A deep rod part is detected when the polished rod workload is reduced to (a default value) of 40% of Base Card workload. The A&E RPC event manager structure allowed high polished rod load parameters to be managed in a very similar way.
Consistent results were sought. Current card area (calculated by RPC) proved less likely to produce false alarms than single point load limits or percentage thresholds. Testing for the condition of higher polished rod work loads over several consecutive strokes helped reduce false alarms.
Field tests proved a fairly simple set of conditions could provide consistent results for most cases. If the Current card area is greater than (default value of 130%) of workload area limit as determined during Base Card capture, for a (default value of 3) consecutive strokes, then a High Polished Rod Effort is declared and alarm is latched. During the next host poll, a message is sent by RTU over data radio indicating the event has occurred. Entering one value enables high Polished Rod Effort Event. This can be done remotely at host or locally using RPC local interface.
| Function | Value | Description |
|---|---|---|
| Enable | 37 in Reg# 10,986 | Standard Configuration |
| Disable | 36 in Reg# 10,986 | Recommended Disable value |
Increased workloads reduce pumping unit performance and increase operating costs. Additional stress reduces system reliability. Fluid production decreases and energy costs increase when increased polished rod loading is not detected and treated.
The early warning provided by this event allows hot water, hot oil, and condensate or chemical treatments to be scheduled one to two weeks in advance.
Treatment methods, quantities of fluids and treatment effectiveness can be measured. Data logging, conditional trending and other predictive maintenance tools are available from the RPC microprocessor for further refinement of high friction load events.
The Emulsification Alarm has been renamed to High Polished Rod Effort Event for three reasons:
- Over time, the emulsification alarm proved to have a more general use for detection of other sources of high friction loads such as: paraffin, asphaltenes, and waxy deposits of various compositions.
- Well analysts found the name alarming.
- We also found production managers were concerned that another alarm would mean losing production (the High Polished Rod Effort Event indicates well condition only and has not been configured for well shutdown)
Reliability Centered Maintenance (RCM) operations can benefit from this predictive maintenance tool. The RPC can control chemical1 injection such as paraffin crystal modifiers to treat wells as required, before workloads impact production.
If a producing well shows a deep rod part after treatment, a new Base Card must be set for the RPC. Base Card capture can be done remotely from host if continuous position input devices are used.
The Base Card used as reference, must reflect operating conditions (full pump with fluid level in operating range). Current and Base Cards should be matched for peaks and size for best results. Well experience will improve the ability to predict when treatments are needed.
The A&E RPC also keeps track of the amount of time the Polished Rod Effort Event is true for each day up to a week. Total time event condition is true, and the number of strokes when event condition is true is available at host or RPC for all defined events.
Case Study
The Cedar Creek anticline in Baker Montana was where we first noticed a need for an alarm to detect emulsion problems. These wells have a lot of asphaltenes in the fluid and when pumped tend to produce a sticky tar like fluid. This condition can be controlled by the injection of chemicals on a regular schedule or as needed. The concern was overspending when not needed or failures when not corrected in time.
Most of our emulsifying wells didn't increase the loads enough to trip a load alarm. We had set the high load alarm at 135% of normal loading. Lower settings gave us a lot of false alarms. The diagnostic cards enlarged about 6 to 10 percent and rotated slightly. Emulsified fluids caused the rods to drag. In turn, this led to increased rod failures and downtime. At today's lower oil prices, a $10,000+ rig job will make many failed wells uneconomical to repair.
These were not instantaneous failures but reduced the life space of the rod string. A 10% increase in the rod loads may not seem like much but when you are pumping from 9000 ft and moving 300+ bbls. with a rod string loaded at 90%+, it is often the difference between failing and not failing. On one well, the Pine 23-32U, we were able to reduce the failures from 7 yearly to 1 failure per 18 months. This is an extreme case but until we were able to detect these changes and treat the wells, we had failure problems.
In Michigan, I am using the alarm to help detect paraffin buildup. Many of our wells don't appear to have problems until it is too late and they are hung. We are fine-tuning the emulsion alarm limits and have seen wells that showed problems before they alarmed on high loads. Our wells are treated on a schedule that tries to balance cost and need. This alarm is showing a lot of potential by catching wells with problems before their scheduled treatment and reducing excessive rig costs.
At the end of the paper, are several cases from Michigan and other fields that show the normal and emulsified surface and down hole cards. These are fairly easy to detect here, but when one person is monitoring 200 to 400 wells, attending meetings and other activities, there is not enough time to monitor all the wells as thoroughly as we would like.
Like other systems, you will only get out of the system what you put into it. Unless your data is accurate and up to date, there will be false alarms. The below picture shows a well with a bad Base Card and the current Alarm Card. This false alarm was corrected by collecting a current base card and setting the loads correctly.
Our treatments are 95% done with the use of 150 barrels (bbl) of hot water and chemical or 100 bbl of condensate. We have several wells on crystal modifier at a continuous rate. The results are usually really good for a while but tend to disappear over time. It appears when using crystal modifiers, the paraffin light ends are removed and the heavies are left. We are testing a quarterly hot water treatment with the crystal modifier for better results.
I started using the emulsion alarm last summer in a limited area to compare with load alarms. The results indicated emulsion alarms gave me an earlier alarm so I switched 98% of my wells to emulsion warning. It is set at 125% of normal and the load alarm is now set at 135%.
Most of the alarms I get are from the north area I oversee. The wells are shallower and have a lighter type of paraffin. At this time I can't track any trends, if a well acts up before it's due treatment day twice, we redo the schedule to prevent having a stuck well. Right now the alarm is mainly used to help me schedule treatments. It enables me to stretch out treatments knowing there is an alarm that will detect a problem developing.
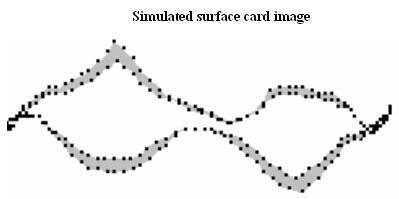
Simulated card outline showing area overlapped between Current Card and reference or Base Card. The increase in surface card area due to increased friction represents a symmetrical 15% increase in area on both up and down portions of stroke (total area increase = 30%).
Case Study of Well Parameters and Emulsion Alarms
We have been comparing the down hole parameters of several wells that alarmed with emulsion problems. I looked at the pump depth and size, rod string and rod type, if guided, fluid pumped, GOR, SPM and rod loads to determine if the well design affects how and when an emulsion alarm is triggered. These wells varied in depth from 4700 ft to 9100 ft. Most of the wells studied had D rods; one had a fiberglass and steel rod string. The tapers had different combinations of 1.25", 1", 7/8" and 3/4" rods with a few sinker bars (1.50"). Most of the rod strings in Michigan were guided. One had the 1" guided and the 7/8" rods were not. The pump sizes ranged from 1.25" to 1.75". The rods were loaded approximately 35 to 90% of rated capacity. The max and min loads ranged from 28,000 max and 7000 min.
| Well # | Gas | Oil | H2O | Gor | Rod type | Guides | Pump | SPM | Pump seat | % Load Change | |
|---|---|---|---|---|---|---|---|---|---|---|---|
| BL 1-20 | 11 | 29 | 29 | 550 | D | Y | 1.25 | 6.6 | 7022 | 2% inc | 31% dec |
| W 6-2 | 31 | 7 | 0 | 4411 | D | Y | 1.25 | 6.3 | 6766 | 6% inc | 4% dec |
| P 1-19 | 66 | 19 | 42 | 3473 | D | Y | 1.25 | 8.2 | 4755 | 8% inc | 26% dec |
| C 1-28 | 14 | 25 | 1 | 560 | D/3 taper | Y | 1.25 | 8.6 | 4755 | 2% inc | 2% dec |
| C 2-11 | 111 | 8 | 1 | 13875 | D | Y | 1.25 | 5.4 | 5227 | 3% inc | 4% dec |
| B 2-25 | 12 | 12 | 0 | 1083 | D/3 taper | Y | 1.5 | 7.2 | 6231 | 4% inc | 3% dec |
| E 22-28C | 3 | 19 | 136 | 159 | D/3 taper | N | 1.5 | 9 | 9089 | 7% inc | 11% dec |
| E 32x-13 | 1 | 25 | 140 | 40 | D/3 taper | N | 1.5 | 7.3 | 8485 | 13% inc | 9% dec |
| S 3-22 | 46 | 4 | 20 | 11500 | D | Y/N | 1.75 | 6 | 6362 | 4% inc | 12% dec |
| N 3-21 | 62 | 13 | 51 | 4769 | F/D | Y | 1.5 | 1.5 | 6750 | 5% inc | 3% dec |
Char 1-28
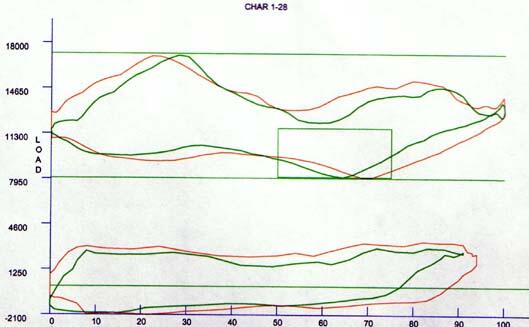
This well has a two taper D rod string that is 45% loaded, an 1.25 pump and produces 70 bbl fluid with 13 mcfs gas. When we received an alarm, the rod loads had increased to 50% and the max and min loads stayed basically the same. The card shape showed a change in the rotation due to the dragging effect of paraffin. The below card shows there was a sizable change in the down hole card.
Pewinski 1-19
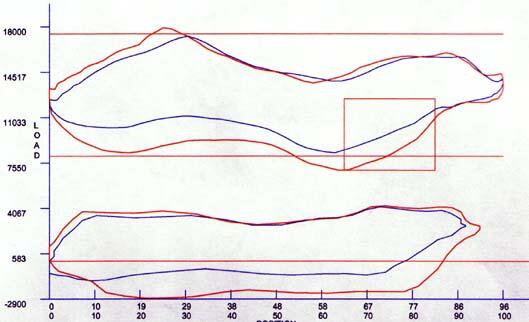
This is another well with a 1.25 pump at 4755 ft with a two taper D rod string. This well produces 20 bbls daily with a gas rate of 165 mcfs. The max and min loads are 17,400 and 8000. When this well alarmed, we saw loads of 17,900 maximum and 7000 min. This well also showed a slight rotation of the card but the change in the overall card size showed a swollen surface and down hole picture. As with the first case shown, there was only a slight change in maximum load but there was a large change to the min loads.
BL 1-20
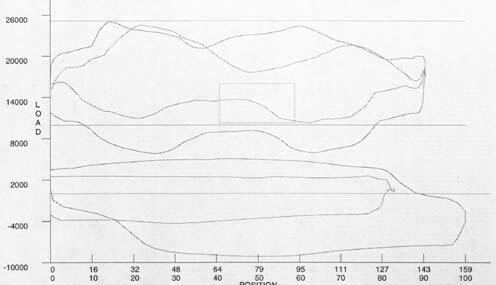
This well hung in the pumping T, showing the greatest load changes of the wells studied. This is a 7000 ft well with a 1.25 pump and running 6.6 SPM. Total productions was 58 bbls fluid and 11 mcfs gas. The D rods are guided and loaded at 75% rated capacity. As with most of these cases, the greatest change happens on the down stroke, both surface and down hole card.
E 32x-13
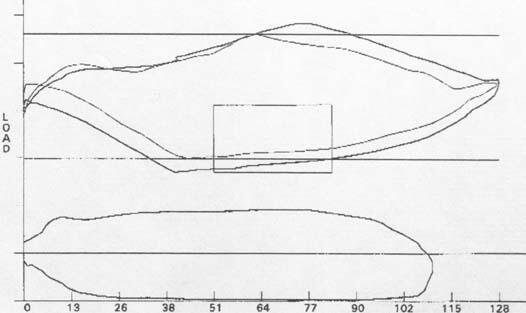
A Montana well, this is one of two cases that helped show the need for an alarm to protect the rod string. They are here to show while they have an emulsion, not paraffin, problem, there is little difference in card/load changes. This well pumps at 8500 ft, 1.50 pump, 3 taper D/El rod string and produces 165 bbl fluid and 1 gas. Loads are 23,600 max and 11,000 min. There is a 13% increase in max loads when there was an emulsion problem.
E 22-28C
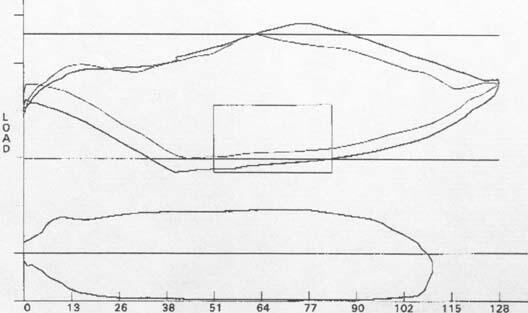
The second Montana case, this well has a pump depth of 9100 ft and a 1.50 pump. Production is 155 bbls fluid and 3 gas daily. It has a three taper D rod string that is also unguided. Max and Min loads are 27,600 and 11,800 with a 7% increase in max loads when emulsified.
Rupp 1-21
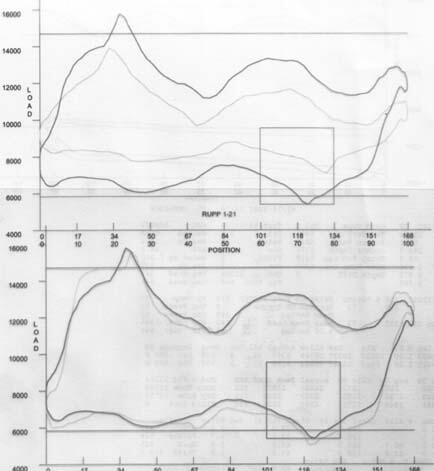
This well alarmed but when checked, we discovered the base card needed to be reset. The two pictures show what an improperly setup well can do to your surveillance program.
Observations
Our treatments are 95% done with the use of 150 bbls hot water and chemical or 100 bbls condensate. We have several wells on crystal modifier at a continuous rate. The results are usually really good for a while but tend to disappear over time. It appears when using crystal modifiers, the paraffin light ends are removed and the heavies are left. We are testing a quarterly hot water treatment with the crystal modifier for better results.
I started using the emulsion alarm last summer in a limited area to compare with load alarms. The results indicated emulsion alarms gave me an earlier alarm so I switched 98% of my wells to emulsion warning. It is set at 125% of normal and the load alarm is now set at 135%.
Most of the alarms I get are from the north area I oversee. The wells are shallower and have a lighter type of paraffin. At this time I can't track any trends, if a well acts up before it's due treatment day twice, we redo the schedule to prevent having a stuck well. Right now the alarm is mainly used to help me schedule treatments. It enables me to stretch out treatments knowing there is an alarm that will detect a problem developing.
Discussion on Case Study
Comments by Ted Lapis are in italics. Comments by Mike Obrigewitsch are in bold.
I think the false alarm card is interesting in that it shows:
- The importance of a good reference (Base Card).
- Normal operations between Deep Rod Part Event (default set 60% below Base Card area, and Emulsification Alarm (default set to 30% over Base Card area) is not difficult to achieve if reference card is reasonably well set.
- In my talks with other producers, the general response to being told that emulsification and paraffin/asphaltenes detection was possible on a reliable and continuous basis was that they had tried different systems that did not work. They spent a lot of time trying to detect wells loading beyond a threshold at some particular pair of load and position points. The problem is the points move (noise, junk, sticking, vibration, rod string spring action, etc), and any particular position value is not likely to be a good indication of overall polished rod effort for a stroke. The area method seems to work better for detecting friction load increases.
Rod guides may help to distribute the emulsification, but the Baker experience shows that guides are not necessary for identification of the problem. We do not have enough data to say if guides are present, the default setting (as a percentage of Base Card) should be lower. A well analyst in Baker suggested that a higher setting might be advisable for small producers (wells that pump-off quickly). Do you also find that to be the case? He seemed to indicate that small producers were harder to get good Base Cards.
Many of my wells tend to pump off quickly because of the low down hole pressure and increases in the flow line pressure. We have not had to change or lower the setting for these wells. Pat is right about getting good base cards but what is a good base card? To me it used to be a full card but experience has taught me to try another route. Now I try to get a base card that is consistent with the normal operating of that particular well. It may not be full but that is what the well will do so that is what we have to accept. So far there has not been any alarms on this kind of base card well. Mainly these are wells that have little or no problems.
Verification that the treatment is effective would be an important consideration. I believe that most wells are over treated because there is not a good way to measure if the treatment was effective.
The only way to check if a treatment was effective is to pull the rods and look at them. TOO EXPENSIVE! We have been able to reduce the number of treatments every year by better surveillance and better tools (your program) etc. While the overall treatment program (trucking, chemical etc.) costs have increased, we have kept the total costs constant and even a slight decrease. Rig pulling jobs have dropped considerably because we catch the well problems sooner.
- It is important that the Surface Base Card shapes line up with the Current Card shapes for the Emulsification Alarm to be most reliable. Retaking Base Cards if the operating conditions change significantly is advised.
Additional Notes: We do not have information on reduced rod string failures cost savings and production loss reduction. There is no data on electrical energy savings, cost improvements due to scheduling treatments, cost improvements due to production improvement, cost improvement due to reducing tubing fatigue. This preliminary report involved no external funding sources, so data collection and correlation on a significant population of wells is waiting future case studies.
Technical Description - A&E RPC Polished Rod Effort Event
Workload Event = Current Card Area > (Base Card Area * Workload Percent)
Comparing card areas instead of a single point promotes close monitoring without false alarms. Large sample sizes allow more precise measurements without nuisance alarms. Requiring a condition to be true for a number of consecutive strokes or consecutive cycles can also reduce false alarms.
Registers: (Implemented as Emulsification Alarm in firmware Version #21 w/ further improvements
| Register Description | Reg# | Default | Summary |
|---|---|---|---|
| Workload Percent | 188 | 130.0% | Percent of Base Card area increase * |
| Calculated Workload Limit in Foot-Pounds | 186 | = Reg# 28,808 (Base Card Area) * Reg#188 (workload %) | |
| Workload Event Configuration (formerly Emulsification detected)** | 10,986 | 37 | (37) enables default configurations |
| Stroke Action 1 | 10,987 | 17 | (17 - Save Alarm Card) |
| Stroke Action 2 | 10,988 | 0 | 0 - No Action |
| Stroke Latch | 10,992 | 0 | Stroke (0 - Not Latched) |
| POC Cycle Action 1 | 10,993 | 17 | (17) Save Alarm Card |
| POC Cycle Action 2 | 10,994 | 0 | No Action |
| POC Cycle Latch | 10,998 | 1 | POC cycle (1 - Latched) |
| State | 10,999 | Current state of input | |
| Actions Taken? | 11,000 | True if actions have executed | |
| Status of Latch | 11,001 | True if latched | |
| Stroke Trigger | 11,002 | 3 | # consecutive strokes with condition = true will latch event |
| # Strokes Event = True | 11,003 | # of strokes event was true since Clear Alarms | |
| Strokes in True Total** | 11,004 | Total # of strokes event is true | |
| Time in True** | 11,005 | ||
| Time Event = True Today** | 11,006 | Total for today | |
| Time in True Today - 1 (Yesterday) ** | 11,007 | Total for yesterday | |
| Time in True Today - 2** | 11,008 | Total for day before yesterday | |
| Time in True Today - 3** | 11,009 | Etcetera | |
| Time in True Today - 4** | 11,010 | ||
| Time in True Today - 5** | 11,011 | ||
| Time in True Today - 6** | 11,012 | ||
| POC Cycle Trigger | 11,013 | 2 | # consecutive POC cycles with event true will latch event |
| POC Cycles Event = True** | 11,014 | # of cycles event was true since Clear Alarms |
*If Reg# 188 is set to 0, RPC uses limit (value in Reg#186) instead of %. Base Card. Max Load Limit = 655,350 lbs.
See Deep Rod Part (Reg#10,319) for alarms / actions taken when Current Cards area < A&E RPC Reg# 28,808 (Base Card Area).
** Values affected by event configuration values. See Event Configuration Table.
For small wells that pump off quickly, the value in Reg#188 (workload %) may need to be increased.
Copyrighted by Southwestern Petroleum Short Course (paper presented April 24 & 25 2002).